

By Preston Ingalls
Fleet equipment is usually the single most tremendous asset, outside of people, for construction companies. If operated and maintained efficiently, your fleet will provide quality service and output within reasonable costs. If operated or maintained inefficiently, the quality of service degrades, and cost escalates. What causes the difference? How do business owners ensure the maximum return on investment? How do you know if your equipment is maintained well? What are the indicators that you are spending too much or too little maintaining that equipment?
As business owners, we assume that the staff we place in charge of managing those assets will perform those duties in the most effective and cost-efficient manner. However, this may be only an assumption. We presume they are rigorously monitoring the costs of services and using trends and patterns to drive a skeptical examination of those costs. We also believe they are benchmarking those costs against others for relative comparison to know if they are within a logical range,
I do not want to alarm you, but in my 30 years as a fleet consultant working with hundreds of operations, I have found a few instances of a meticulous cost control regarding fleet management. Now, this is not to imply your staff are wantonly spending money to no end, but it does indicate that stable fiscal control of fleet expenditures may be lacking, causing you to spend too much on your fleet upkeep.
GETTING THE BEST YIELDS
Let us examine some ways to see if we are getting the best yields and returns from our equipment. Return on Capital Employed (ROCE) is a gauge indicating the efficiency and profitability of applying a company’s capital investments. We need to calculate the existing Return on Capital Employed (ROCE) as a benchmark to compare it later. ROCE is calculated as:

ROCE is a calculation that indicates the efficiency and profitability of a company’s capital investments.
Obviously, ROCE should always be higher than the rate that the company borrows at; otherwise, any increase in borrowings will reduce shareholders’ returns and earnings. It is a measure of the returns that a company realizes from its capital; therefore, capital employed. It is calculated as profit before interest and tax divided by the difference between total assets and current liabilities. It represents the efficiency with which money is being utilized to generate revenue. When external benchmark numbers are unknown to compare to, the owner can still examine the trend. The fact is, improving maintenance practices should indicate a positive trend of an increasing ROCE over time.
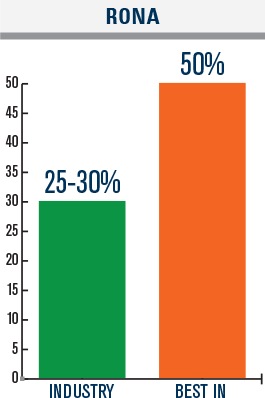
Another measure, even more utilized than ROCE, is RONA, Return on Net Assets. A standard alternate to ROCE would be to measure Return on Net Assets as a benchmark to evaluate our returns from your fleet investment. RONA is calculated as:

Our consulting firm uses RONA as a good indicator of fleet investment return. We have developed benchmarks over the years for relative comparison. Here is what we found in comparing “average” fleets to “Best in Class” fleets.
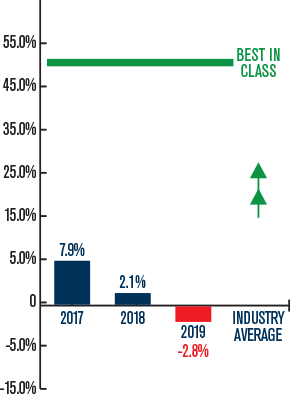
The absence of tracking RONA can lead to the following, an actual chart from an assessment of a new client. As you see, their RONA has been diminishing over the last few years. They had not been tracking RONA, and inadequate maintenance practices became very evident in high costs and low returns on investment.
As the charts indicate, well-maintained and controlled fleets produce double the returns than the average. Efficient maintenance practices such as Preventive Maintenance (30 to 50% of maintenance working hours), carefully monitored Operator Care for frontline maintenance (100% applied and audited), efficiently applied Maintenance, Repair, and Operational Supplies (inventory control) producing turn rates higher than 2, technical training for mechanics or techs (at least 2 weeks per year for each), utilizing a sturdy and capable Computerized Maintenance Management System (CMMS) producing reports for constant analysis of failures and spending trends, along with careful monitoring of fleet maintenance costs compared to asset value and sales.
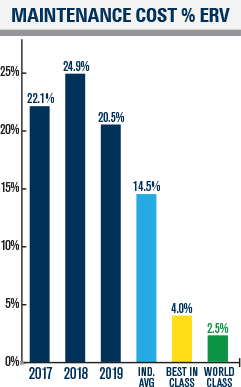
One standard measure to assess whether you are spending too little or too much on maintenance is to look at the ratio of maintenance expenditures as a percent of Estimated Replacement Value (ERV) or Fleet Replacement Value (FRV). ERV is the cost to replace, in kind, your total fleet. In some cases, it is referred to as the insured value of the equipment. It is the costs to replace the equipment with ones of comparable value (not new), fair market value. Maintenance expenditures include all maintenance labor, parts and materials, and cost of maintenance overhead. It excludes fuel and depreciation, which is a production consumable and tax burden, but not a cost of maintenance.
The chart below shows a company’s maintenance costs relative to its fleet replacement value compared to itself for 3 years (the three bars to the far left), compared to the industry average (the light blue bar in the middle), compared to Best in Class (best in the industry) with the yellow bar, and finally compared to World Class to the far right, which represents the best in all sectors. We can see they are spending too much.
Most see maintenance as merely the function or activities to keep the equipment functional. To a reasonable extent, that is true. The equipment division or shop is charged with enabling operations to do their job efficiently and cost-productive by providing equipment in a constant state when needed. Therefore, the equipment division or shop is charged with maximizing production capacity. If all they do is “fix things,” they may not be doing the right things to ensure that equipment is running well since fixing is reactive by nature.
Few companies track any maintenance performance or cost metrics, Key Performance Indicators (KPIs), to allow them to know what is working and what is not to improve.
CLOSING THOUGHT
As an owner, begin the journey to reducing maintenance costs by providing visible leadership asking critical questions and showing support for equipment improvement. Suppose you are unhappy with the returns from your fleet … do something about it!
About the author:
Preston Ingalls is president and CEO of TBR Strategies, LLC, a Raleigh, North Carolina-based maintenance and reliability firm specializing in the construction and oil and gas industries. Preston can be reached at pingalls@tbr-strategies.com.
Modern Contractor Solutions, September 2020
Did you enjoy this article?
Subscribe to the FREE Digital Edition of Modern Contractor Solutions magazine.
